Welcome to our comprehensive guide on Bollinger Bands, an essential tool for traders and investors looking to navigate the financial markets successfully. In this article, we will explore the intricacies of Bollinger Bands and highlight their practical applications in trading strategies. With a deep understanding of Bollinger Bands, you can harness the power of market volatility, generate accurate trading signals, and enhance your technical analysis skills.
But first, let’s delve into what exactly Bollinger Bands are. Bollinger Bands consist of three bands plotted around a security’s price movement: the upper band, middle band, and lower band. The upper and lower bands capture price volatility by adding or subtracting a multiple of the standard deviation from the middle band, which represents a simple moving average. Traders can customize Bollinger Bands to suit their trading style by adjusting the lookback period for the moving average and the number of standard deviations used.
One of the key benefits of using Bollinger Bands is their ability to provide valuable insights into market volatility. By observing the contraction and expansion of the bands, traders can gauge the level of volatility in the market. Additionally, Bollinger Bands can help identify overbought and oversold conditions. Breaches of the upper or lower bands can indicate potential selling or buying opportunities, respectively.
In the following sections of this guide, we will explore effective strategies for using Bollinger Bands, examine how to combine them with other indicators, discuss customizing Bollinger Bands for different timeframes, and provide practical tips for successful Bollinger Bands trading. By the end of this guide, you will have a comprehensive understanding of how to leverage Bollinger Bands to improve your trading performance.
Stay tuned for our next section, where we will dive deeper into understanding Bollinger Bands and their practical applications. We’ll explore how to identify market volatility, detect overbought and oversold conditions, and predict potential price reversals. Buckle up – there’s much to learn!
Understanding Bollinger Bands and Their Practical Applications
Bollinger Bands are an essential tool for traders seeking to measure market volatility and identify potential trading opportunities. They offer valuable insights into price movements and can help traders make informed decisions.
One key aspect of Bollinger Bands is the ability to gauge market volatility. When the bands widen, it suggests increased volatility, meaning that prices are likely to experience larger swings. On the other hand, when the bands contract, it indicates decreasing volatility, suggesting a period of relative price stability.
Bollinger Bands also provide valuable information about overbought and oversold conditions in the market. The upper band can act as a resistance level, indicating that prices may be overbought. This implies that there is a higher probability of a downward price reversal or correction. Conversely, the lower band can serve as a support level, indicating that prices may be oversold. In such cases, traders may anticipate a potential upward price reversal or bounce.
Furthermore, Bollinger Bands can be used to identify price reversals. When the price breaches the upper band, it suggests a potential reversal to the downside, indicating a sell opportunity. On the other hand, when the price breaches the lower band, it signals a possible reversal to the upside, offering a potential buy opportunity.
The practical applications of Bollinger Bands in trading are numerous. Traders can use these bands to establish entry and exit points, set stop-loss orders, and manage risk effectively. By incorporating Bollinger Bands into their trading strategies, traders can refine their market analysis and improve their overall decision-making process.
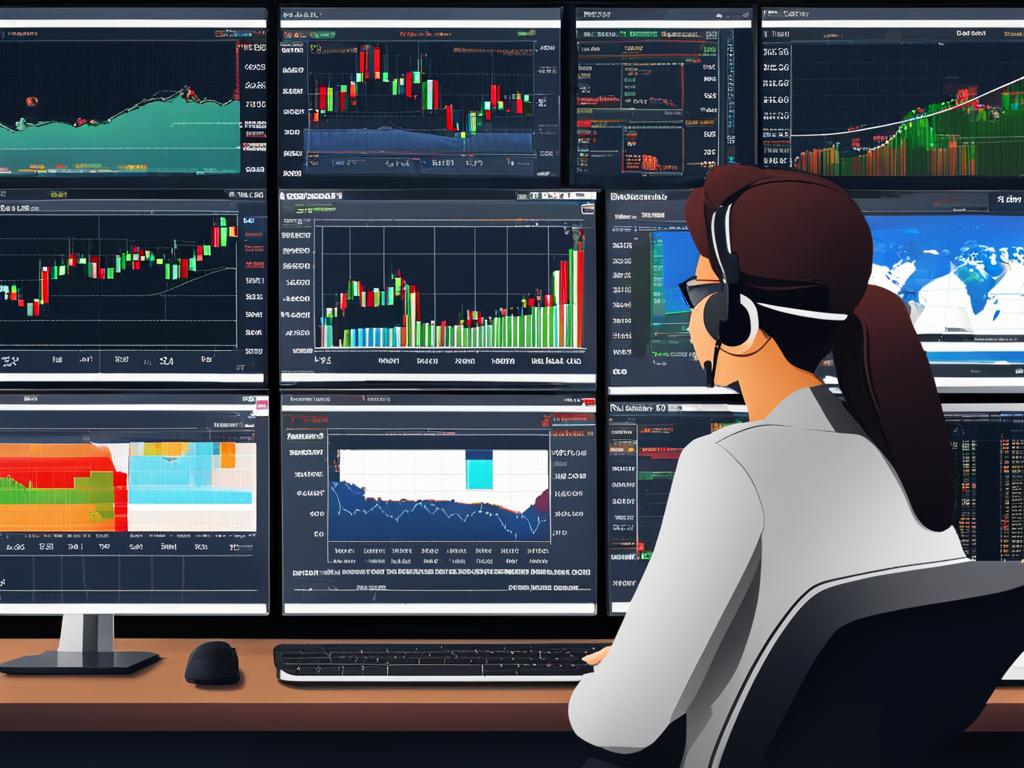
To visualize the concepts discussed, the image below provides an example of Bollinger Bands applied to a price chart:
Effective Strategies for Using Bollinger Bands
Traders can utilize various strategies with Bollinger Bands to enhance their trading. One such strategy is the Bollinger Band Squeeze. This strategy takes advantage of periods of low volatility, anticipating potential price breakouts when the bands begin to expand. Traders can look for a narrowing of the bands, indicating a decrease in volatility, and expect an imminent price move. When the bands start to widen again, it suggests that volatility is picking up, presenting a potential trading opportunity.
Another popular strategy is the Bollinger Band Breakout. This involves entering a trade when the price breaks through the upper or lower bands, signaling a continuation of the current trend. When prices breach the upper band, it indicates a bullish trend, and traders may consider opening a long position. Conversely, when prices breach the lower band, it suggests a bearish trend, and traders may consider opening a short position.
The Bollinger Band Walk strategy focuses on strong trends by entering long positions when the price bounces off the upper band in uptrends and off the lower band in downtrends. This strategy assumes that the price will continue to move in the same direction as the trend. Traders can aim to capture the trend by entering positions at these bounce points, increasing the probability of a profitable trade.
It’s important for traders to remember that these strategies can be customized based on their risk tolerance and trading style. By combining Bollinger Bands with other technical indicators and conducting thorough analysis of market conditions, traders can refine their trading strategies and improve their overall success rate.
Using these strategies, traders can harness the power of Bollinger Bands to enhance their trading performance and generate consistent profits. But remember, successful trading requires continuous learning, practice, and disciplined execution of strategies.
Using Bollinger Bands with Related Indicators
Traders can enhance the effectiveness of Bollinger Bands by combining them with other technical indicators. Popular complementary indicators include the Relative Strength Index (RSI), Moving Average Convergence Divergence (MACD), and Stochastic Oscillator. These indicators can help confirm trading signals generated by Bollinger Bands, reduce false signals, and improve the overall success rate of trading strategies.
For example, traders can use the RSI to confirm overbought or oversold conditions when the price touches the upper or lower bands, and the MACD can indicate a bullish or bearish crossover when the price bounces off the bands.
Incorporating these related indicators with Bollinger Bands provides traders with additional insights into market trends and potential trading opportunities. By analyzing the signals from multiple indicators, traders can make more informed decisions and increase their chances of successful trades.
Next, let’s explore the importance of customizing Bollinger Bands for different timeframes and the impact it can have on trading strategies.
Customizing Bollinger Bands for Different Timeframes
Traders have the flexibility to apply Bollinger Bands to various timeframes, including daily, hourly, or minute charts. The effectiveness of Bollinger Bands can vary depending on the timeframe used. Shorter timeframes, such as minute charts, may generate more frequent signals but are also more susceptible to false signals and market noise. On the other hand, longer timeframes, such as daily or weekly charts, may produce fewer signals but are generally more reliable.
When customizing Bollinger Bands for different timeframes, traders should consider adjusting the length of the Simple Moving Average (SMA) in the middle. By increasing or decreasing the number of periods used for the SMA, traders can adapt the Bollinger Bands to capture the desired timeframe.
It is essential for traders to incorporate appropriate risk management techniques when utilizing Bollinger Bands for different timeframes. Implementing stop-loss orders and position sizing strategies helps manage potential risks and protect capital.
By customizing Bollinger Bands to suit different timeframes and implementing effective risk management strategies, traders can maximize the potential of this powerful technical analysis tool and improve their trading outcomes.
Practical Tips for Successful Bollinger Bands Trading
When it comes to trading with Bollinger Bands, implementing effective strategies and employing proper risk management techniques is crucial for success. Here are some practical tips to enhance your trading performance and maximize the potential of Bollinger Bands.
1. Practice Risk Management: Prioritize risk management by using essential tools such as stop-loss orders, position sizing, and diversification. These techniques help protect your capital and minimize potential losses.
2. Experiment with Bollinger Bands Settings: Bollinger Bands offer customization options to suit individual trading styles and specific instruments. Explore different settings, including the length of the moving average and the number of standard deviations, to find the optimal configuration for your strategy.
3. Use Additional Technical Indicators: Enhance the accuracy of Bollinger Bands signals by incorporating complementary technical indicators. By verifying the signals with indicators like the Relative Strength Index (RSI), Moving Average Convergence Divergence (MACD), or Stochastic Oscillator, you can increase the reliability of your trading decisions.
4. Exercise Patience: Avoid impulsive trading and wait for high-quality trade setups that align with your trading strategy and risk tolerance. Patience is key when using Bollinger Bands, as it allows for better evaluation of market conditions and reduces the likelihood of entering trades based on false signals.
5. Review and Analyze Trading Performance: Continuously monitor and assess your trading performance to identify areas for improvement. Analyzing your trades can help you refine your strategies, adjust your approach, and enhance your overall trading performance.
By following these practical tips, traders can optimize their Bollinger Bands trading strategy, improve risk management, and ultimately achieve better trading results. Remember, Bollinger Bands are a powerful tool, but successful trading also requires discipline, knowledge, and continuous evaluation of performance.
Conclusion
In conclusion, Bollinger Bands are a valuable tool for traders and investors looking to navigate the complexities of the financial markets. With their ability to offer insights into market volatility, potential trends, and trading opportunities, Bollinger Bands have become an essential component of effective trading strategies.
By understanding the mechanics of Bollinger Bands and incorporating them into their technical analysis, traders can enhance their ability to make well-informed decisions. Bollinger Bands should be used in conjunction with other technical indicators and risk management techniques to mitigate the limitations inherent in this strategy.
To further deepen their understanding, traders are encouraged to study real-life examples and case studies that demonstrate successful applications of Bollinger Bands. This practical experience can provide valuable insights and enable traders to refine their trading strategies.
With consistent practice and a commitment to proper risk management, traders can harness the power of Bollinger Bands as an effective tool in their trading arsenal. By utilizing this technical analysis indicator, traders can improve their market analysis, identify potential trading opportunities, and ultimately enhance their overall trading performance.